
Your engineering org is leaking money through identity gaps right now. Not the dramatic kind of loss that triggers a postmortem, but the steady, compounding kind that hides inside onboarding timelines, incident response, code review queues, agent failures, and compliance audits. The loss is real and it is calculable, if you know where to look.
This article gives you a model. Five cost buckets, each with a mechanism, supporting data, and a formula you can plug your own numbers into. At the end, we work through a concrete example for a 50-engineer, 150-service org. You should be able to open a spreadsheet when you finish reading.
What we mean by identity gaps
An identity gap is any place where a service, component, or system boundary lacks a clear, testable declaration of what it is, what it does, what it does not do, and what guarantees it makes. The gap shows up when someone (or something) needs to understand a system and the documentation, specs, and context artifacts are missing, stale, vague, or contradictory.
Identity gaps are not the same as missing docs. A 200-page Confluence space full of outdated architecture diagrams is an identity gap. A README that says "this service handles payments" without specifying failure modes, latency guarantees, or trust boundaries is an identity gap. Any place where a human or agent must rely on tribal knowledge instead of a verifiable declaration is an identity gap.
Here are the five places those gaps show up on your P&L.
Bucket 1: The onboarding tax
New engineers arrive and immediately need answers to a set of basic questions. What does this service do? What are its boundaries? What can I safely change, and what will break something downstream? When those answers live in people's heads instead of in testable declarations, onboarding slows to the speed of Slack messages and pairing sessions.
The numbers are bad. Cortex's 2024 engineering survey found that 72% of respondents say it takes one month or more for new hires to submit their first three meaningful pull requests. 40% cite "gathering project context" as the top blocker. Port.io's research puts the average onboarding timeline at six weeks, with an estimated cost of $75,000 or more in lost productivity per engineer.
The mechanism is straightforward. Without clear identity declarations, every question about system behavior requires interrupting a senior engineer. The new hire's ramp time stretches, and the senior engineer's productive time shrinks. You pay twice.
The formula:
| Variable | How to measure it |
|---|---|
| New hires per quarter (N) | Your hiring plan |
| Weeks to first meaningful PR (W) | Ask your managers |
| Fully loaded weekly cost per engineer (C) | Salary + benefits + overhead / 52 |
| Percentage of ramp time spent on context gathering (P) | Cortex data suggests 40%; your number may vary |
| Senior engineer interrupt hours per new hire per week (S) | Track it for one sprint |
| Senior engineer hourly cost (H) | Fully loaded comp / 2,080 |
Quarterly onboarding tax = N x W x C x P + N x W x S x H
The first term is what you lose from the new hire sitting idle. The second is what you lose from seniors answering questions that a clear declaration would answer on its own.
Bucket 2: The incident amplifier
When something breaks, the first question is always "what is this service supposed to do?" If the answer requires paging someone who built it three years ago, your mean time to resolution (MTTR) stretches. Every minute it stretches, you are burning money.
How much money? New Relic's 2025 Observability Forecast reports the median cost of high-impact outages at $2 million per hour. The annual median cost of downtime across surveyed organizations is $76 million. The same research shows that organizations with full-stack observability cut outage costs roughly in half.
The identity gap connection is direct. Runbooks, dependency maps, and failure mode documentation are all identity artifacts. When they are missing or stale, the on-call engineer is debugging without a map. They are reading code to understand intent, tracing calls to discover dependencies, and guessing at failure modes that should have been declared.
The formula:
| Variable | How to measure it |
|---|---|
| High-impact incidents per quarter (I) | Your incident tracker |
| Average MTTR in hours (M) | Your incident tracker |
| Hourly cost of downtime for your org (D) | Revenue at risk + SLA penalties + labor |
| Percentage of MTTR spent on context gathering (G) | Estimate from postmortems; 30-50% is common |
Quarterly incident cost from identity gaps = I x M x G x D
If strong identity declarations cut outage costs roughly in half (consistent with the New Relic data on observability and runbooks), this bucket alone can justify the investment.
Bucket 3: The review bottleneck
Code review is where identity gaps create the most insidious drag. Without clear declarations of what a service is and what it is not, reviewers must reconstruct intent from code, then judge whether changes align with an architecture that exists mostly in their heads.
Research from Google found that developers spend an average of 6.4 hours per week on code review. That is a full working day, every week, for every senior engineer on your team. Worse, Cortex's data shows that one or two senior engineers review 60-80% of all PRs, creating a single point of failure in your delivery pipeline. Stripe's Developer Coefficient research found that developers spend 42% of their time on technical debt and bad code, leaving a fraction for actual feature development.
The identity gap mechanism here is concentration. When only a few people hold the mental model of the system, only those people can judge whether a change is safe. You cannot distribute review load without distributing the context that makes review possible.
The formula:
| Variable | How to measure it |
|---|---|
| Senior reviewers carrying 60%+ of reviews (R) | Your PR analytics |
| Hours per week each spends on review (V) | 6.4 hours is the Google average |
| Percentage of review time spent reconstructing context (X) | Estimate 30-50% based on how often reviewers ask "what is this service supposed to do?" |
| Fully loaded hourly cost of senior engineers (H) | Same as above |
| Weeks per quarter (Q) | 13 |
Quarterly review bottleneck cost = R x V x X x H x Q
This does not account for the opportunity cost of PRs waiting in queue while seniors are overloaded, or the throughput hit from blocking junior engineers who cannot get reviews.
Bucket 4: Agent waste
This bucket is new and growing fast. As teams adopt AI-assisted development, the quality gap between agent-authored and human-authored code maps directly to identity gaps.
CodeRabbit's 2025 analysis found that AI-authored pull requests contain approximately 1.7x more issues than human-authored ones. Qodo's 2025 survey found that 65% of developers say AI misses critical context during refactoring, and 44% blame missing context specifically for quality degradation. The pattern is clear: agents produce worse output when they lack identity context, and right now most of them lack it.
The mechanism is the same one that hurts new hires, amplified. An agent with no identity declaration will generate code that is syntactically correct and functionally wrong for the architecture. It will cross boundaries that should not be crossed, miss failure modes that should be handled, and create dependencies that violate undeclared constraints. Every PR that gets rejected, revised, or reverted is waste.
The formula:
| Variable | How to measure it |
|---|---|
| Agent-authored PRs per quarter (A) | Your PR analytics (filter by bot/copilot authors) |
| Rejection or major-revision rate (F) | Track for one month |
| Average hours to fix a rejected agent PR (T) | Track for one month |
| Fully loaded hourly cost of the engineer fixing it (H) | Same as above |
Quarterly agent waste = A x F x T x H
If your agents are producing 1.7x more issues than humans and 44% of that delta traces to missing context, the fix is not better models. It is better declarations.
Bucket 5: Compliance drag
Compliance audits are identity gap detectors. An auditor's job is to verify that your systems are what you say they are and do what you say they do. When your identity declarations are incomplete or stale, compliance becomes a manual evidence-gathering exercise that pulls engineers off feature work.
Secureframe's data shows that first-time SOC 2 compliance requires 100 to 300+ hours of internal labor and $20,000 to $150,000 in internal costs, not counting external audit fees. Cortex's survey found that 56% of engineering leaders cite manual follow-up as the primary production readiness blocker.
The identity gap mechanism is evidence generation. When services have clear, up-to-date identity declarations (ownership, dependencies, SLOs, data classification, access controls), most compliance evidence can be generated automatically. When those declarations are missing, an engineer has to manually trace each requirement to each system, write prose explaining what the system does, and hope the auditor agrees with their interpretation.
The formula:
| Variable | How to measure it |
|---|---|
| Compliance frameworks you maintain (K) | SOC 2, HIPAA, PCI, ISO 27001, etc. |
| Engineering hours per framework per quarter (L) | Ask whoever owns compliance |
| Fully loaded hourly cost of those engineers (H) | Same as above |
| Percentage of that time spent on evidence gathering vs. actual control implementation (E) | 60-80% is common for orgs without automated evidence |
Quarterly compliance drag = K x L x H x E
This bucket gets larger with every new framework you add and every service you launch.
Worked example: a 50-engineer, 150-service org
Let's run the numbers for a mid-size engineering org. These assumptions are deliberately moderate.
Assumptions:
| Parameter | Value | Rationale |
|---|---|---|
| Fully loaded engineer cost | $200,000/year ($96/hr, $3,846/wk) | Mid-market, including benefits and overhead |
| Senior engineer cost | $250,000/year ($120/hr) | Senior/staff level |
| New hires per quarter | 5 | ~20% annual growth |
| Weeks to first meaningful PR | 5 | Below the 6-week average |
| Context-gathering percentage (onboarding) | 40% | Cortex data |
| Senior interrupt hours per new hire/week | 3 | Conservative |
| High-impact incidents per quarter | 4 | Roughly one per month |
| Average MTTR | 2 hours | Below industry median |
| Hourly downtime cost | $50,000 | Mid-market, not hyperscale |
| MTTR context-gathering percentage | 40% | Postmortem estimates |
| Senior reviewers carrying 60%+ load | 8 | Out of 50 engineers |
| Review hours per week per senior | 6.4 | Google data |
| Review context-reconstruction percentage | 35% | Conservative |
| Agent-authored PRs per quarter | 400 | Growing fast in most orgs |
| Agent PR rejection/major-revision rate | 30% | Below the 1.7x issue rate |
| Hours to fix a rejected agent PR | 2 | Average |
| Compliance frameworks | 2 | SOC 2 + one other |
| Engineering hours per framework/quarter | 150 | Mid-range of Secureframe data |
| Evidence-gathering percentage | 70% | Typical without automation |
The math:
| Bucket | Calculation | Quarterly cost |
|---|---|---|
| Onboarding tax | (5 x 5 x $3,846 x 0.40) + (5 x 5 x 3 x $120) | $38,460 + $9,000 = $47,460 |
| Incident amplifier | 4 x 2 x 0.40 x $50,000 | $160,000 |
| Review bottleneck | 8 x 6.4 x 0.35 x $120 x 13 | $27,956 |
| Agent waste | 400 x 0.30 x 2 x $120 | $28,800 |
| Compliance drag | 2 x 150 x $120 x 0.70 | $25,200 |
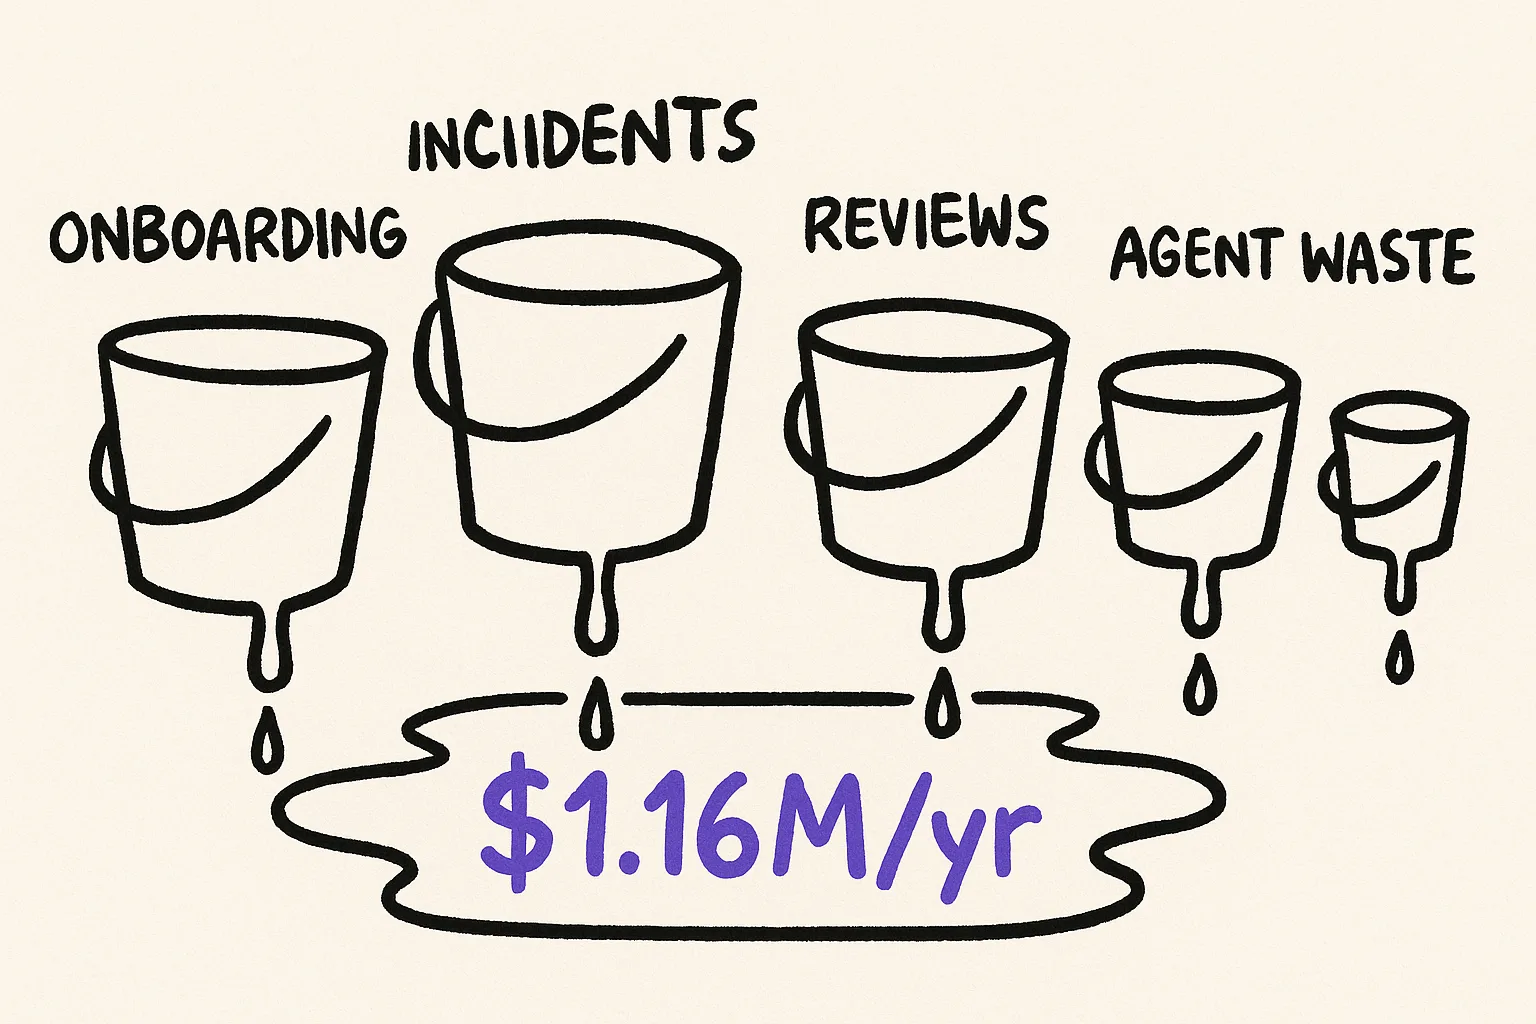
| Total | $289,416/quarter |
That is roughly $1.16 million per year, for a 50-person engineering org, from identity gaps alone. And these are conservative numbers. We used a $50,000/hour downtime cost, not the $2 million median that New Relic reports. We assumed below-average onboarding time. We used a modest agent PR volume.
Scale this to 200 engineers and 600 services and the number approaches $4-5 million per year without changing any of the unit economics.
The DORA multiplier
Here is the part that turns a cost calculation into a strategic argument. Documentation quality does not add to engineering capability. It multiplies it.
DORA's capabilities research found that documentation quality amplifies the impact of other technical practices. Trunk-based development gets a 1,525% performance lift when paired with quality documentation. Continuous integration gets a 750% lift. Continuous deployment gets a 656% lift. These are not additive improvements. They are multiplicative.
This means that the identity gap cost is actually an undercount. You are not just losing the dollars in the five buckets above. You are also leaving a multiplier on the table for every other engineering investment you make. That CI/CD migration you spent $500,000 on? Its returns are a fraction of what they could be because your engineers and agents are still navigating systems without clear identity declarations.
The implication is uncomfortable but useful: fixing identity gaps may have a higher ROI than the next feature, the next hire, or the next platform migration. Not because identity is more important than those things, but because identity multiplies the return on all of them.
Monday morning
Here is what you do with this.
Open a spreadsheet. Create five tabs, one for each bucket. Fill in the variables with your own numbers. You know your hiring plan, your incident rate, your MTTR, your review load distribution, your agent adoption rate, and your compliance burden. You do not need to guess at most of these; they are sitting in your existing tools.
A few of the variables will require estimation (context-gathering percentages, primarily). Start with the ranges in this article and refine them over a quarter of measurement. Even with rough estimates, the order of magnitude will be clear.
Then ask one question: what would it cost to close the identity gaps, and how does that compare to what the gaps are costing you now?
In most orgs, the answer is not close. Closing the gaps costs less, often by an order of magnitude, than tolerating them. The reason the gaps persist is not economics. It is that nobody has done the math.
Now you have the math. Use it.
Identity gaps are measurable and fixable. We are building the tooling to close them, starting with declarations that are testable, not just aspirational.